Sphere Visualizer
Project by:
Dorian Tovar
Diego Rojas
How we can see the music that we listen?
There are numerous ways to achieve this, some of this are very easy to interpret, some others are very complex and need some analysis to understand them.
Let's take for example the regular bars audio visualizers that come in the sound equipment digital screens that we found in our homes, or even in the audio software were we listen our favorite tunes. This bars visualizers move accord to the intensity of the music.

In some other cases, sometimes we can see when specialized audio processing software draws the "audio waves" over time, like the ones that we see when we open a song in softwares like Audacity.
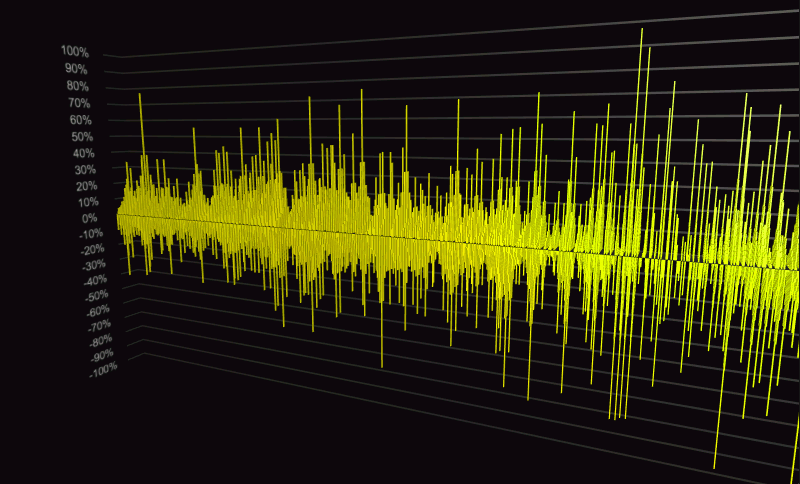
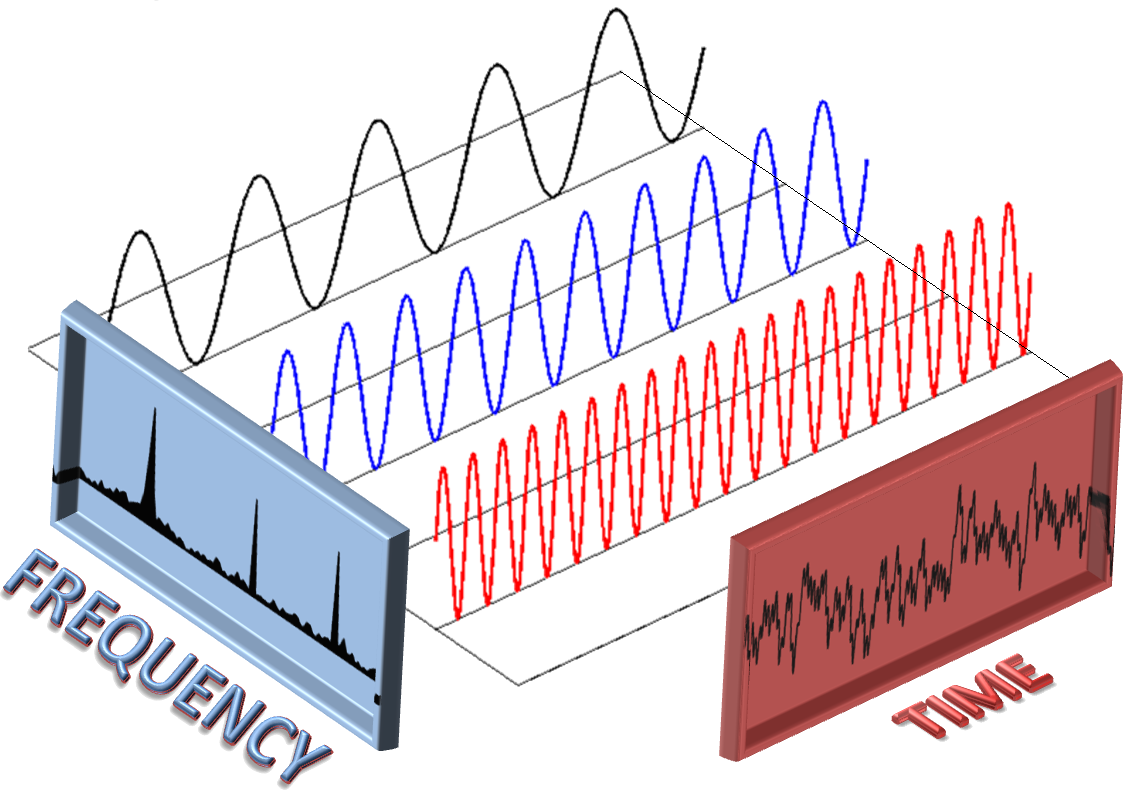
All of this is possible thanks to a very useful signal analysis tool in the engineering and math fields, the Fourier Transform, an mathematical tool that allows us to decompose a signal, in this case, a sound one, from its time to the size of its frequencies in that same lapse of time.

In simpler words, it indicate us the different intensities in our songs, thats when we hear that the bass sounds louder than any other sound in the song or when we hear violins with its high pitch sounds.
Now, when we think in the ways that we see this music waves, they're not very "artsy" nor easy to understand in all cases, so, how can we make them more attractive to our eyes?.
In recent years, the graphics computing have developed amazing new ways of visual surroundment and envolvement of the user using techniques like the Virtual Reality, that gives you the feeling of being part of a scene created by computers.
So what's the problem?
The visual part of the interactions between audio and graphics are very limited and usually can't create a profound synesthesia between the hearing and seeing of the user, mainly because the lack of a deep visual scenography that immerses the user and encapsulates its senses.
The main goal to achieve is the integration of two fields of media processing in computer informatics, the audio processing and computer graphics, in a simple yet very attractive way.
The Solution
We want to visualize the instensity of the music that you hear using very simple geometric shapes, in this case spheres that changes its form over the rythm of a song that you choose previously.
Technologies
To make Sphere Visualizer possible, we use mainly three technologies:
- Web Audio API
- Three.js
- WebVR

Web Audio API
The Web Audio API allow us to manage audio in a web context, allowing to process the audio as signals and get in the case of this application, the frequencies through the Fourier transform.
Three.js - WebVR
With Three.js we can display a 3D scene that contains our visualizer, it uses WebGL and the great advantage is its API WebVR, that gives a still experimental but functional development of virtual reality technology, that allow us to display our visualize in a VR environment.
Conclusions
The main goal of the project was achieve a high synesthesia from audio and visual interactions, but we add an amazing user visual experience through VR technology.
Conclusions
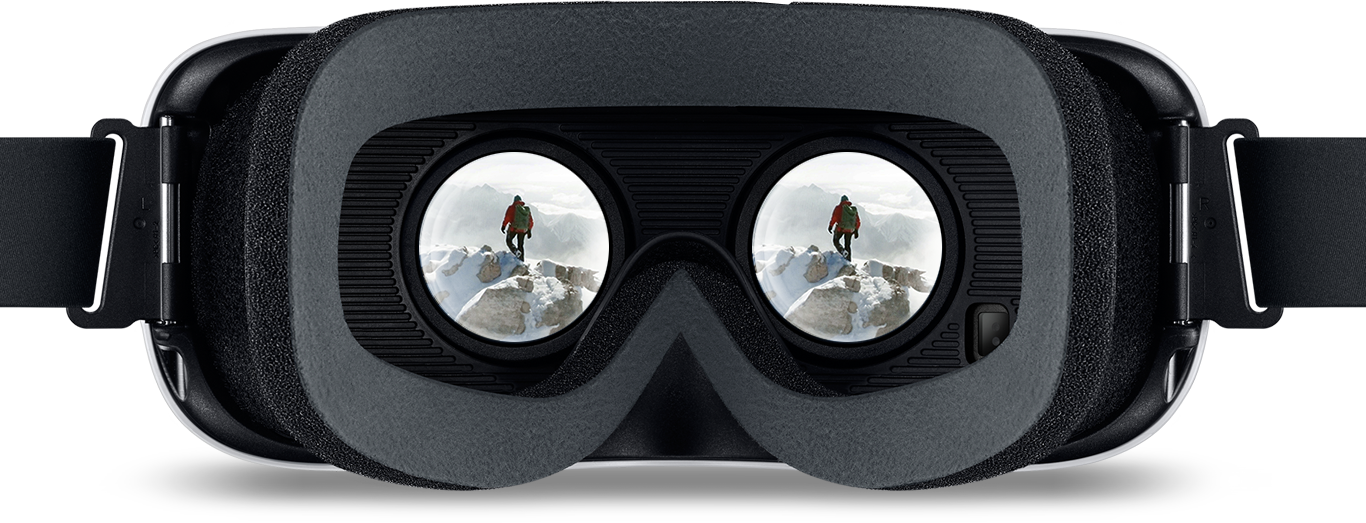
Currently advance VR technologies like Oculus´ Rift can be expensive but the use of smart phones as main hardware open the chance to get cheaply a VR headset with many posibilities in areas like games, culture, music, among others.
Conclusions
The smart phones hardware has processing limitations, to implement some of the high performance capabilities like moving cameras, dynamic lights or intense shaders, it's neccesary an analysis of incremental cost of the hardware that executes the project. In the future, it expects that smart phones will have more powerfull hardware to improve the VR experience.